How does one become a data journalist?
I'm still unsure, for it still seems odd to call myself a journalist. Nevertheless, I find data to be a fascinating enrichment of storytelling. Therefore, I'm here to convince the Miami community to see the importance of properly utilizing data in journalism.
What began as an attempt to establish a new student organization focusing on data journalism has instead led me to becoming the first-ever Data Editor at The Student. The staff and I are excited to announce the launch of a brand new section devoted to entirely data: Miami Metrics.
I have never written articles for any publication, and I still have so much to learn about journalism more broadly. In spite of my lack of experience, I'd argue that I already possess the genes needed to become a journalist.
My father won the New York State award for best high school publication when he was editor-in-chief of his high school's newspaper.
While working for his alma mater, he convinced The Washington Post to profile his former professor, Jan Karski, a forgotten Polish spy who witnessed Nazi concentration camp atrocities and tried to alert the Allies.
With my dad's support, Karski's story was published by The Post and The International-Herald Tribune, then a Paris-based English-language newspaper, and Karski soon received global recognition for his heroism.
By the time my father was 25, he became the editor-in-chief of a real estate magazine in Washington, D.C.
I have yet to achieve anywhere near the accomplishments that my father has. However, I believe I can honor his memory by continuing his legacy of discovering innovative ways to tell stories.
So, why did I choose data as my medium?
Data itself is a form of communication, providing quantitative information that can be interpreted in a variety of ways. Not only is its existence ubiquitous in the STEM fields, but it is also relevant in the humanities and social sciences.
Geometric proportions and light ratios are data observed in art, along with the fact that colors can be quantified by their associated wavelength. Maps are a form of geographic data. Education and healthcare require the use of data and statistics to measure and improve performance. Economic data measures the health of financial and reproductive health of communities. Sports and data are intertwined with one another.
Enjoy what you're reading?
Signup for our newsletter
Every academic discipline and profession records data of some type, so it is imperative to utilize statistical analyses, not only for research and development but also to enhance communication of information and ideas.
But not everyone who reads The Student is well-versed in the analytical methods used in statistics. My goal as Data Editor will be to explore the ways in which I can transform data from being a perplexing concept to a widely-used form of communicating information.
The key to understanding data better is in its visualization. Numbers and other quantifiable information must be visualized properly in order to maximize the effectiveness of communicating that information.
We must develop alternate ways to visualize and mentally absorb data. Stories have multiple perspectives; so does data.
Data is imprecise. Even the most meticulously collected data will still have a degree of uncertainty attached to it. Visualizations must communicate the idea that data isn't always cut and dried.
As editor of Miami Metrics, I intend to focus on the collection, visualization and analyses of data that describe Miami University and Oxford, Ohio. Future editions will include observational studies of data concerning various aspects of our community, from student demographics and dining halls to administration policy and our Uptown habits.
Wouldn't it be interesting to know the day of the week that Miami students are most likely to purchase a trashcan from Brick?
If I took zero credit hours, I would be able to conduct all of these studies by myself. Since that isn't the case, I need motivated and innovative students to help me meet the demand that Miami Metrics creates.
Naturally, I'm in need of students majoring in statistics or related fields to help me conduct the studies and run analyses. But, I encourage anyone who is interested in data and storytelling to reach out to me. I especially want design students to help me with visualizations.
Data is the future of journalism. Miami Metrics has the opportunity to profoundly change the way we understand the value of data as a means of communication. As Data Editor, I hope to raise our expectations for how information is communicated to us.
Read More
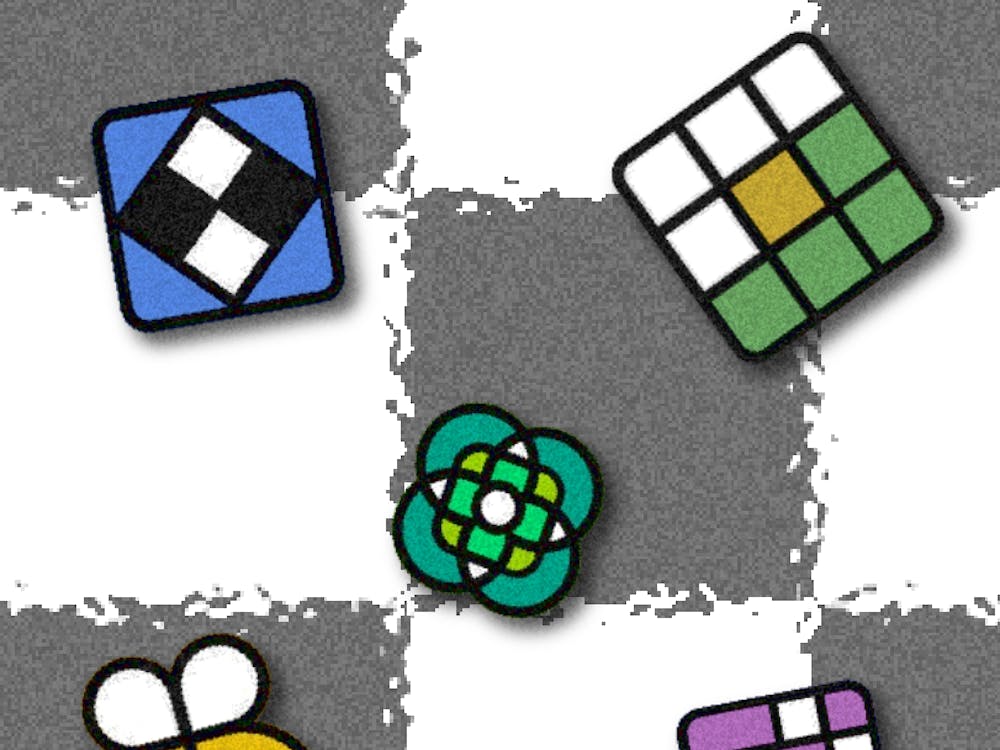
I played every New York Times game for a week
By Meredith Perkins | 3 days agoColumnist Meredith Perkins ranks the New York Times games after playing them all each day for a week.
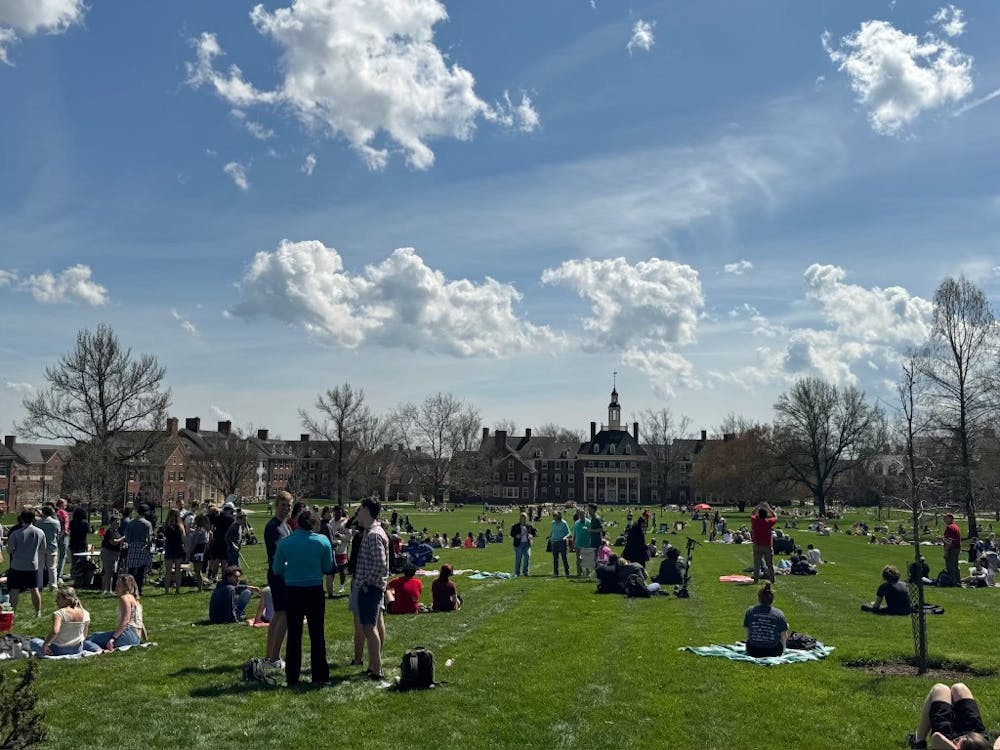
Fascinating, weird and dangerous: Oxford experiences once-in-a-lifetime solar eclipse
By Whitney Wilson-Harris | 6 days agoThe solar eclipse was a momentous event, but for some students with disabilities it posed unique, and possiby dangerous, situations.
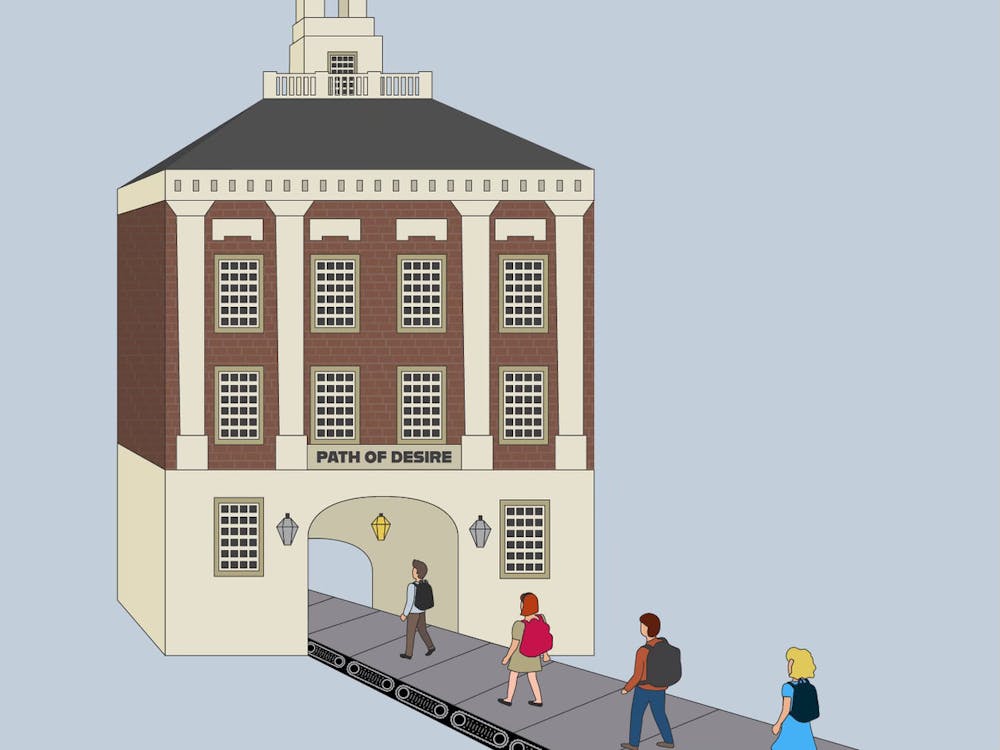
Desire paths are for sheep
By Lilly McClelland | April 9, 2024You are not a trailblazer for taking desire paths. You are not staging a silent rebellion. Rather, these pathways, more strongly than sidewalks, represent the absence of freedom from industrial control.